Project Objectives
The primary objective of the GraphTer project is to develop a versatile, client-side web application using HTML, CSS, and JavaScript that empowers users to effortlessly convert diverse data sources into insightful, customizable graphs in real-time. The tool is designed to be highly accessible, offering multiple pathways for data input—from intelligent text analysis to direct hardware integration—and providing robust options for visual customization and exporting.
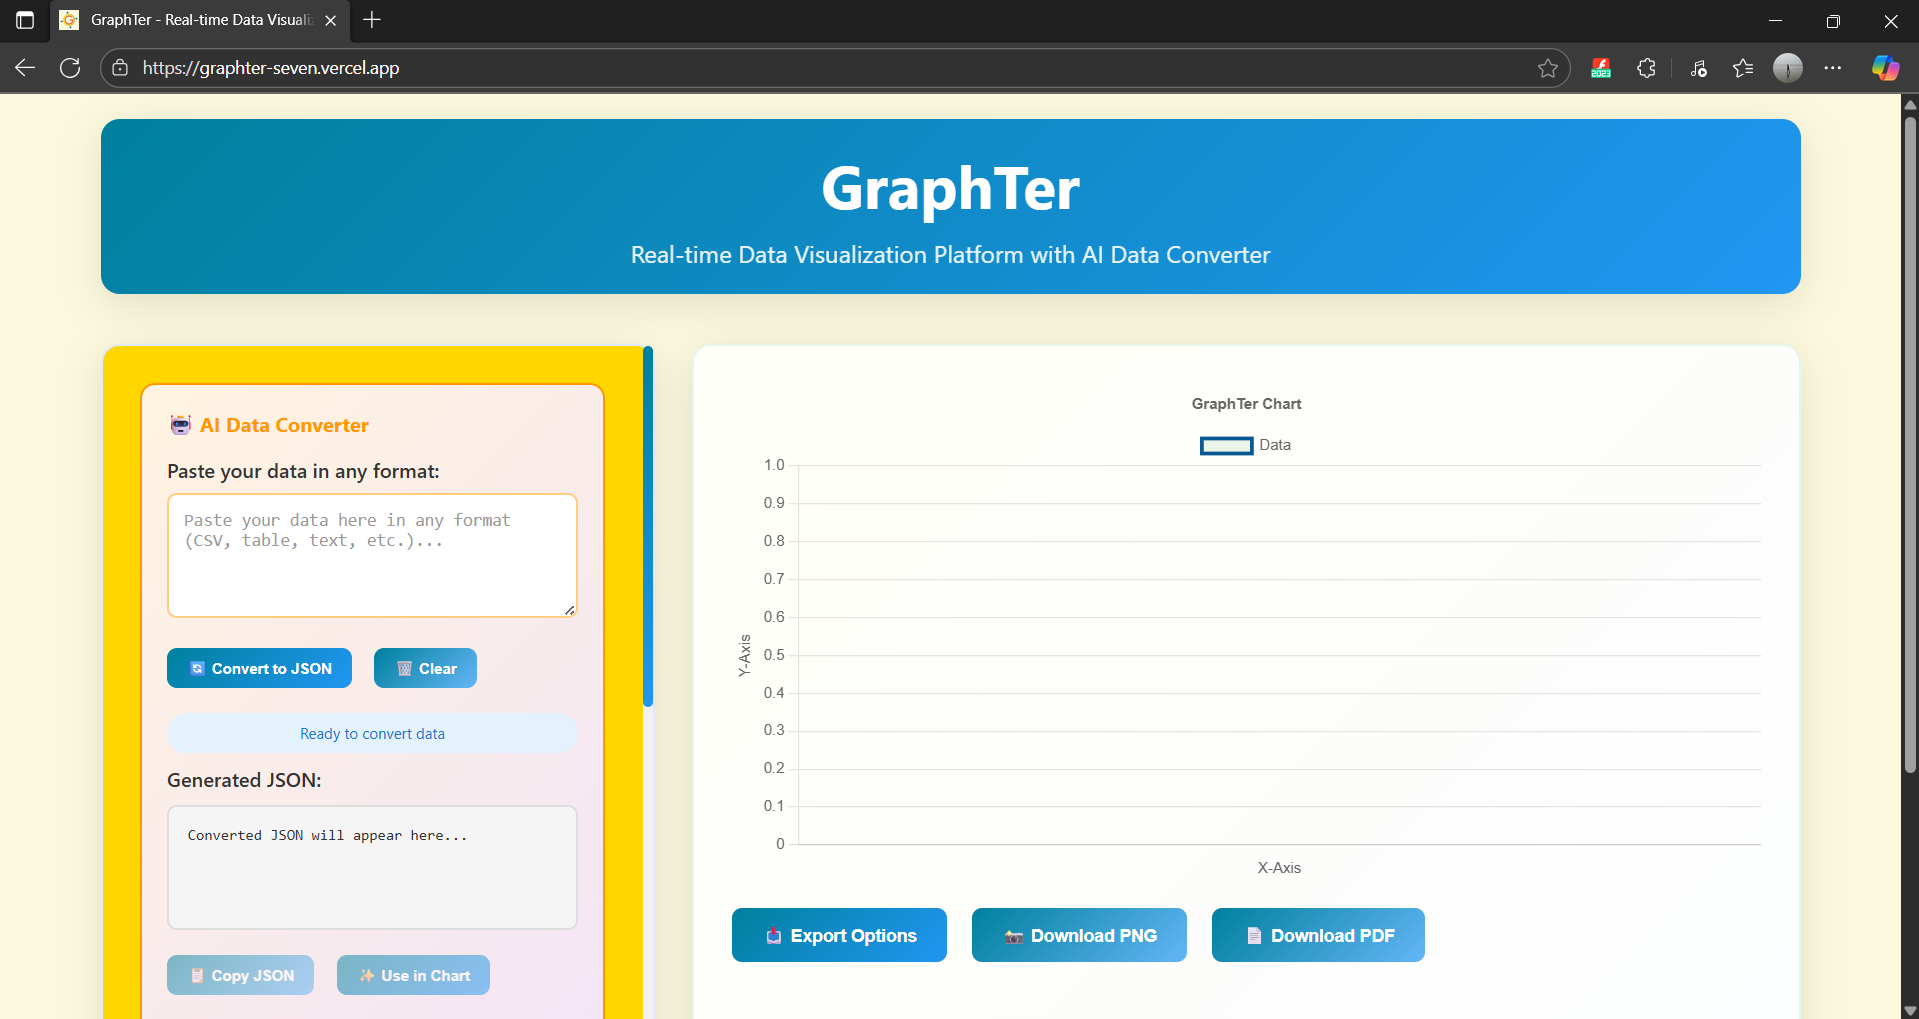
- Flexible Data Input: Provide three easy ways to add data:
- AI Converter: Automatically create a graph by simply pasting text.
- Live Hardware Link: Connect to Arduino/ESP boards to plot real-time sensor data.
- File Upload: Directly use data from JSON or CSV files.
- Dynamic Customization: Allow users to instantly modify their graphs:
- Change the chart type (e.g., line, bar, scatter).
- Customize colors, and add a title and axis names.
- Easy Exporting: Enable users to download their finished graphs in popular formats like PNG, PDF, or SVG.
How It Works?
Just paste your data and click "Convert to JSON". The chart will update live!